Skip To Main Content
Primary Navigation
Services
Blog
About Us
Our Team
Mission & Values
Careers
Contact Us
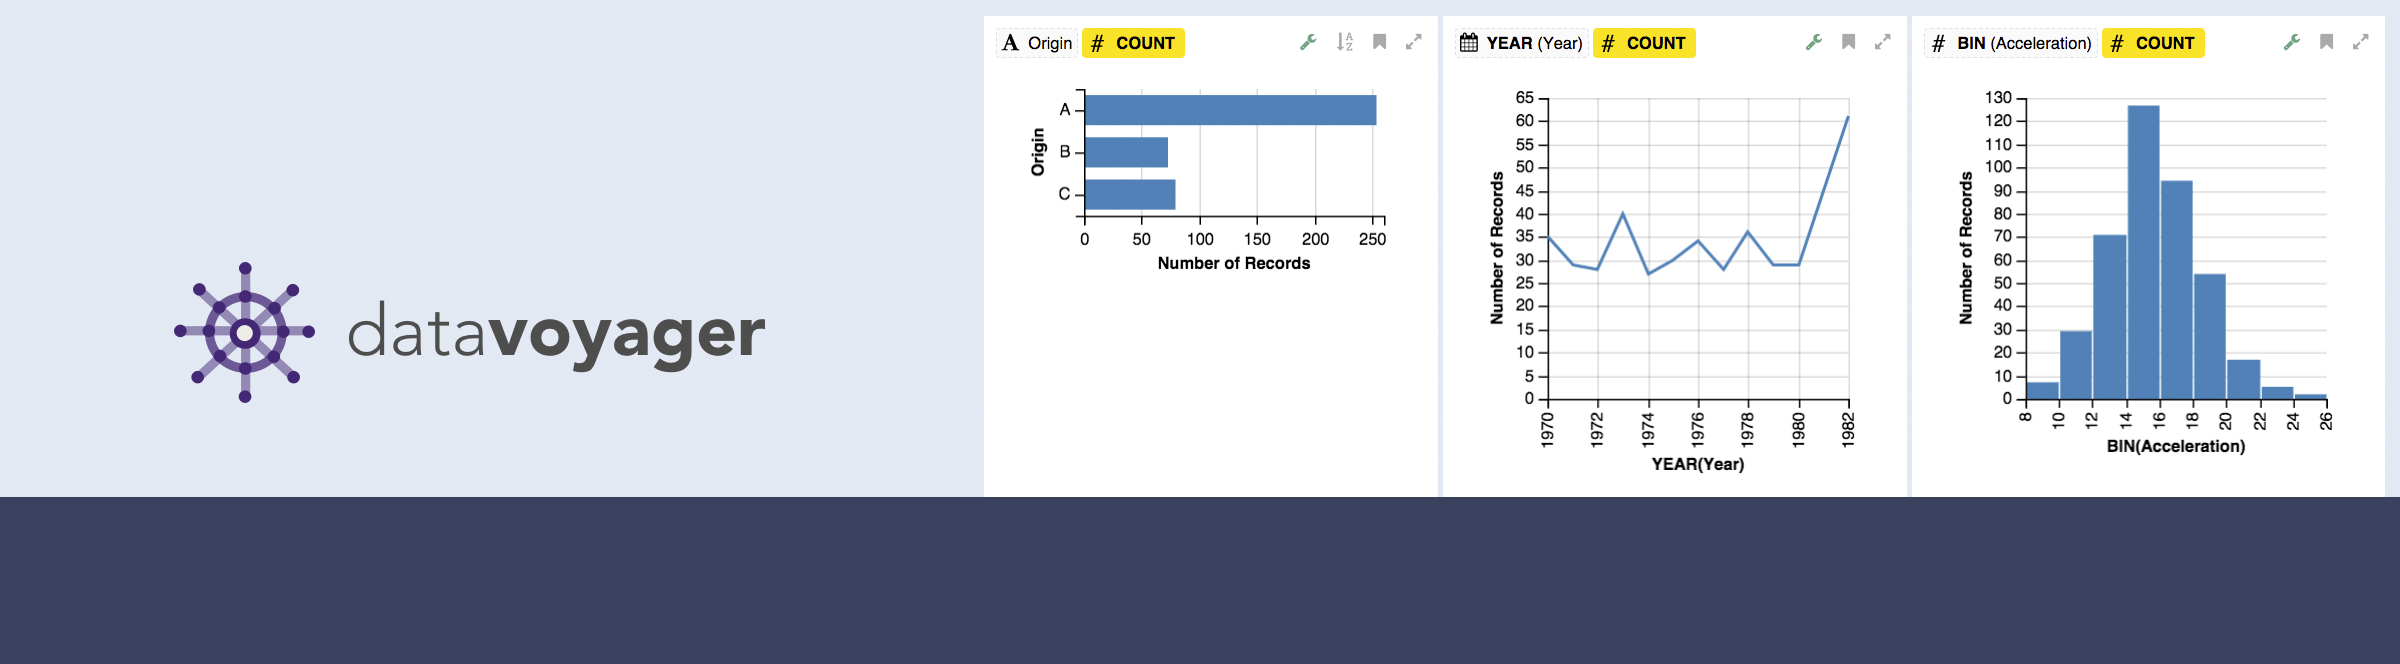
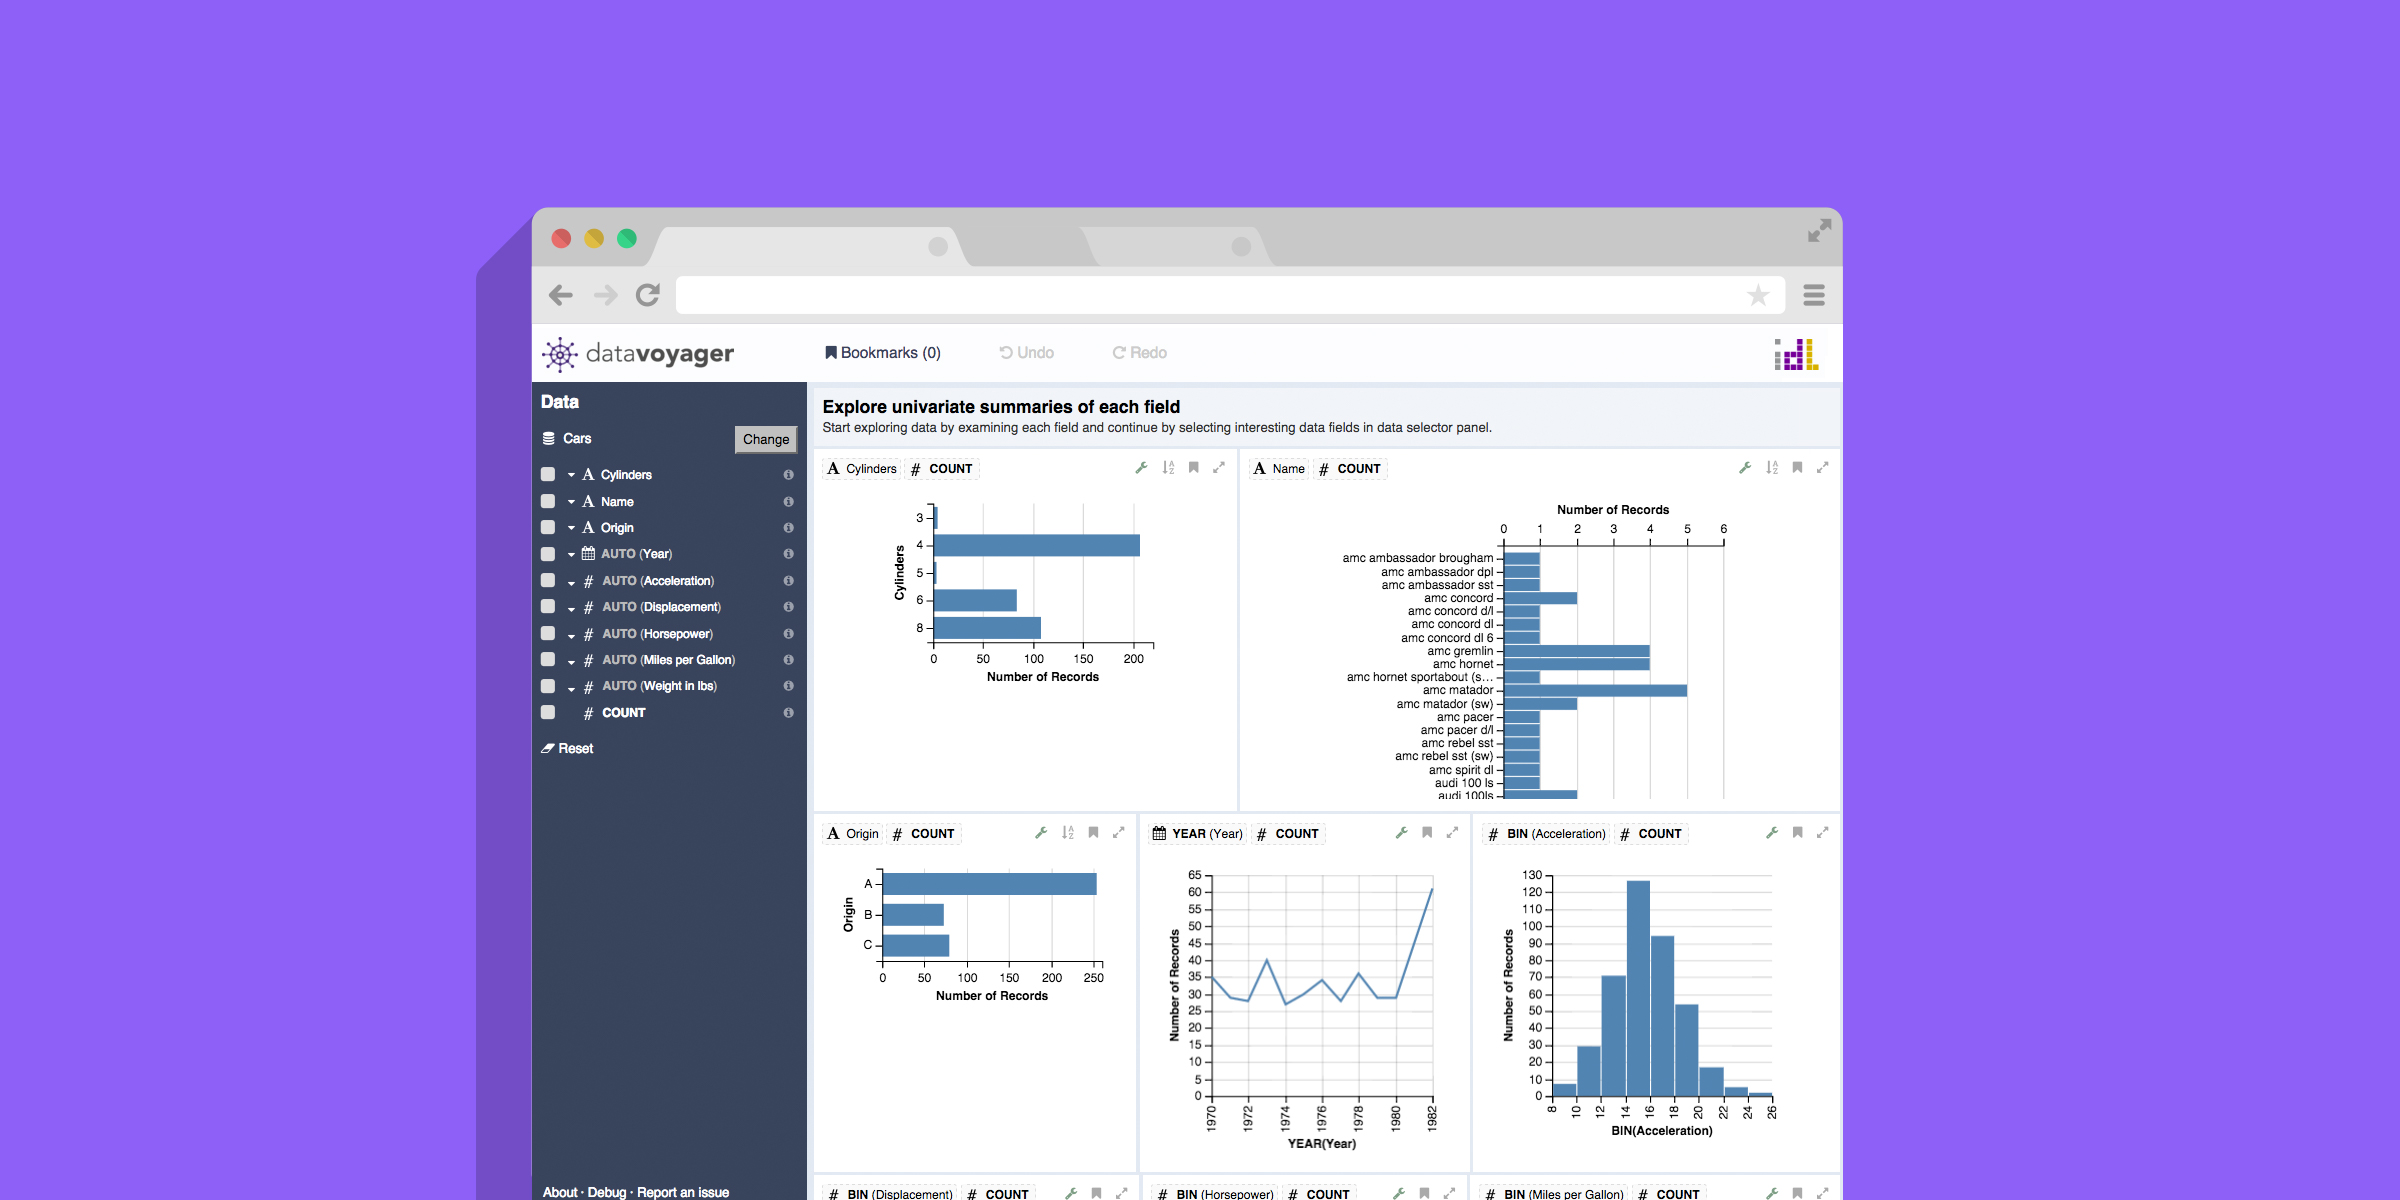
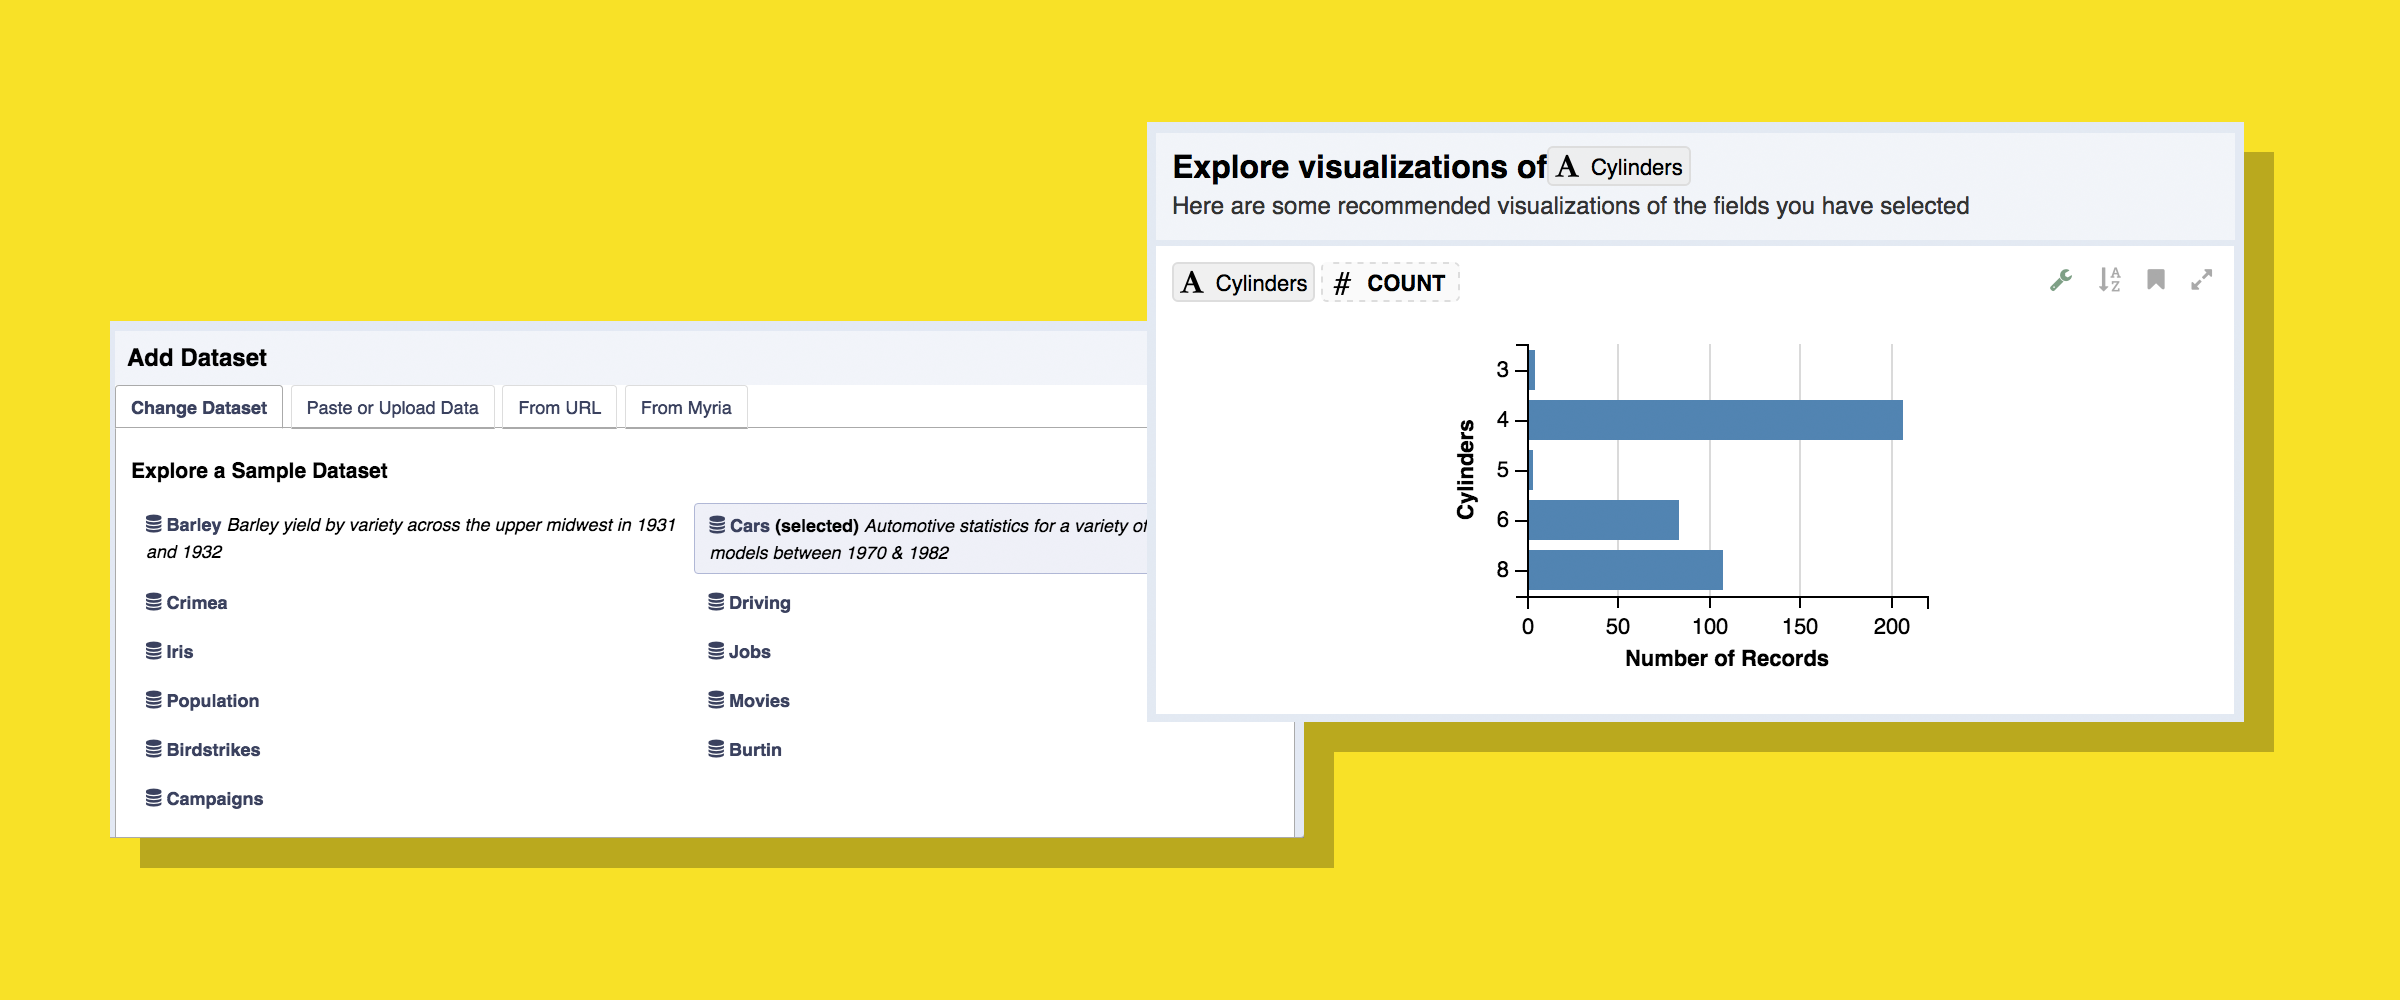
Voyager
University of Washington Interactive Data Lab
Making data exploration and visual analysis more accessible with Voyager
Challenge
Solution
Impact
More work like this at Bocoup
Pombot
Bocoup
Learn More
about Pombot
CSS Conf
Bocoup
Learn More
about CSS Conf
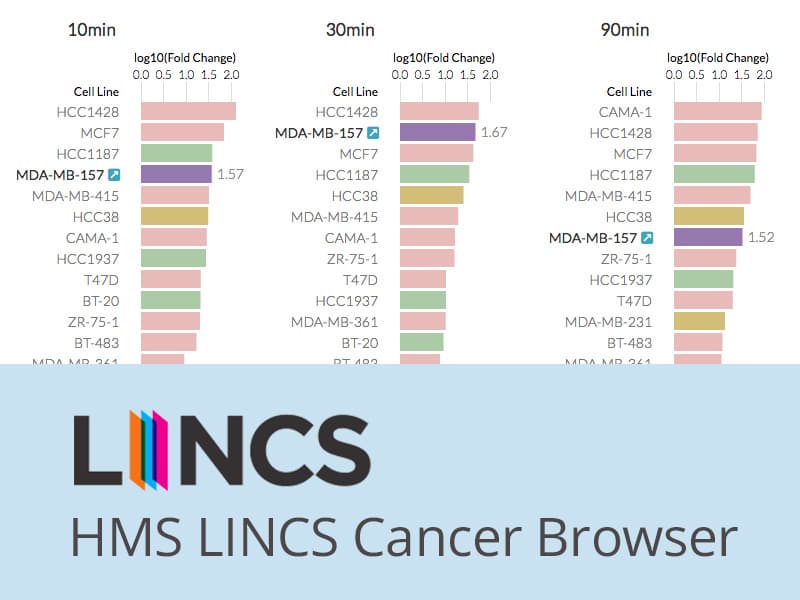
HMS LINCS Breast Cancer Browser
Harvard Medical School
Learn More
about HMS LINCS Breast Cancer Browser
Contact Us
We'd love to hear from you. Get in touch!
Email
hello@bocoup.com