Skip To Main Content
Primary Navigation
Services
Our Work
Blog
About Us
Our Team
Mission & Values
Careers
Contact Us
Visualizing Data with D3.js Training
Public
Building with D3.js through project-based learning
Challenge
Solution
Impact
More work like this at Bocoup
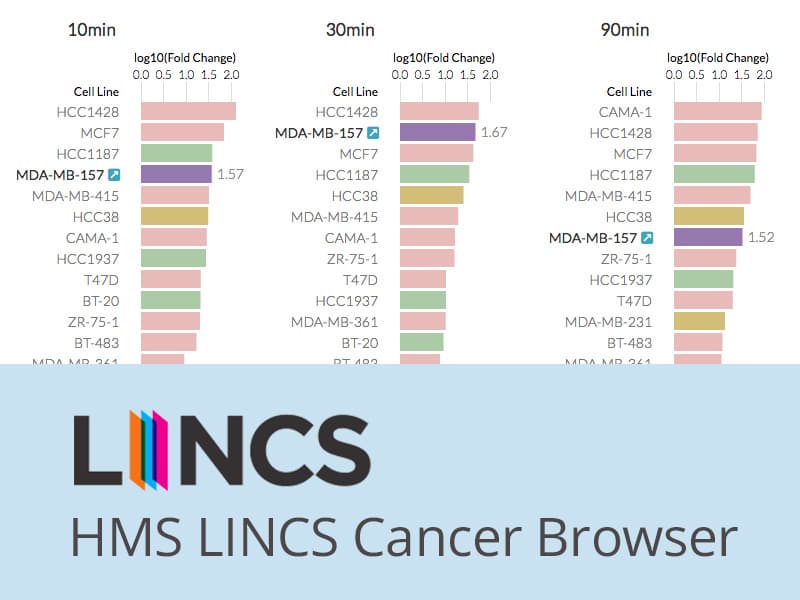
HMS LINCS Breast Cancer Browser
Harvard Medical School
Learn More
about HMS LINCS Breast Cancer Browser
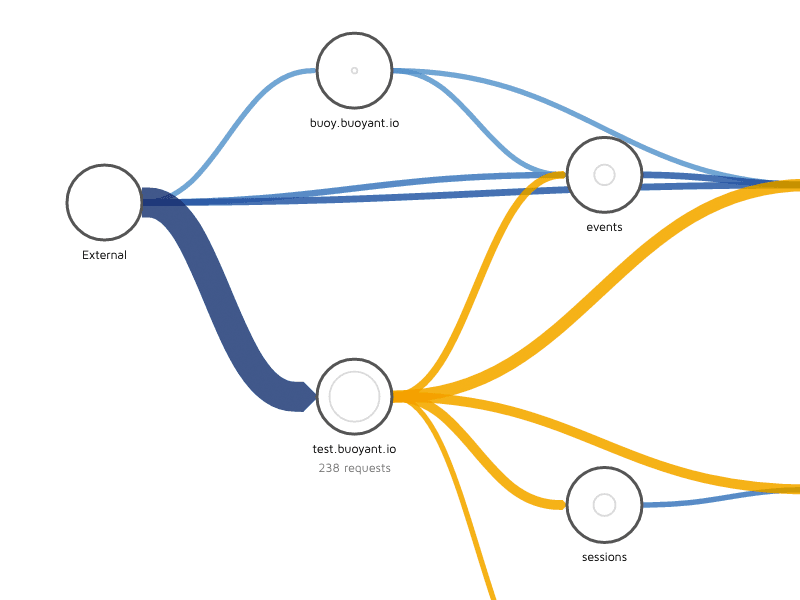
Microservice Networks
Buoyant
Learn More
about Microservice Networks
Onsite JS Training
Vidyo
Learn More
about Onsite JS Training
Contact Us
We'd love to hear from you. Get in touch!
Email
hello@bocoup.com