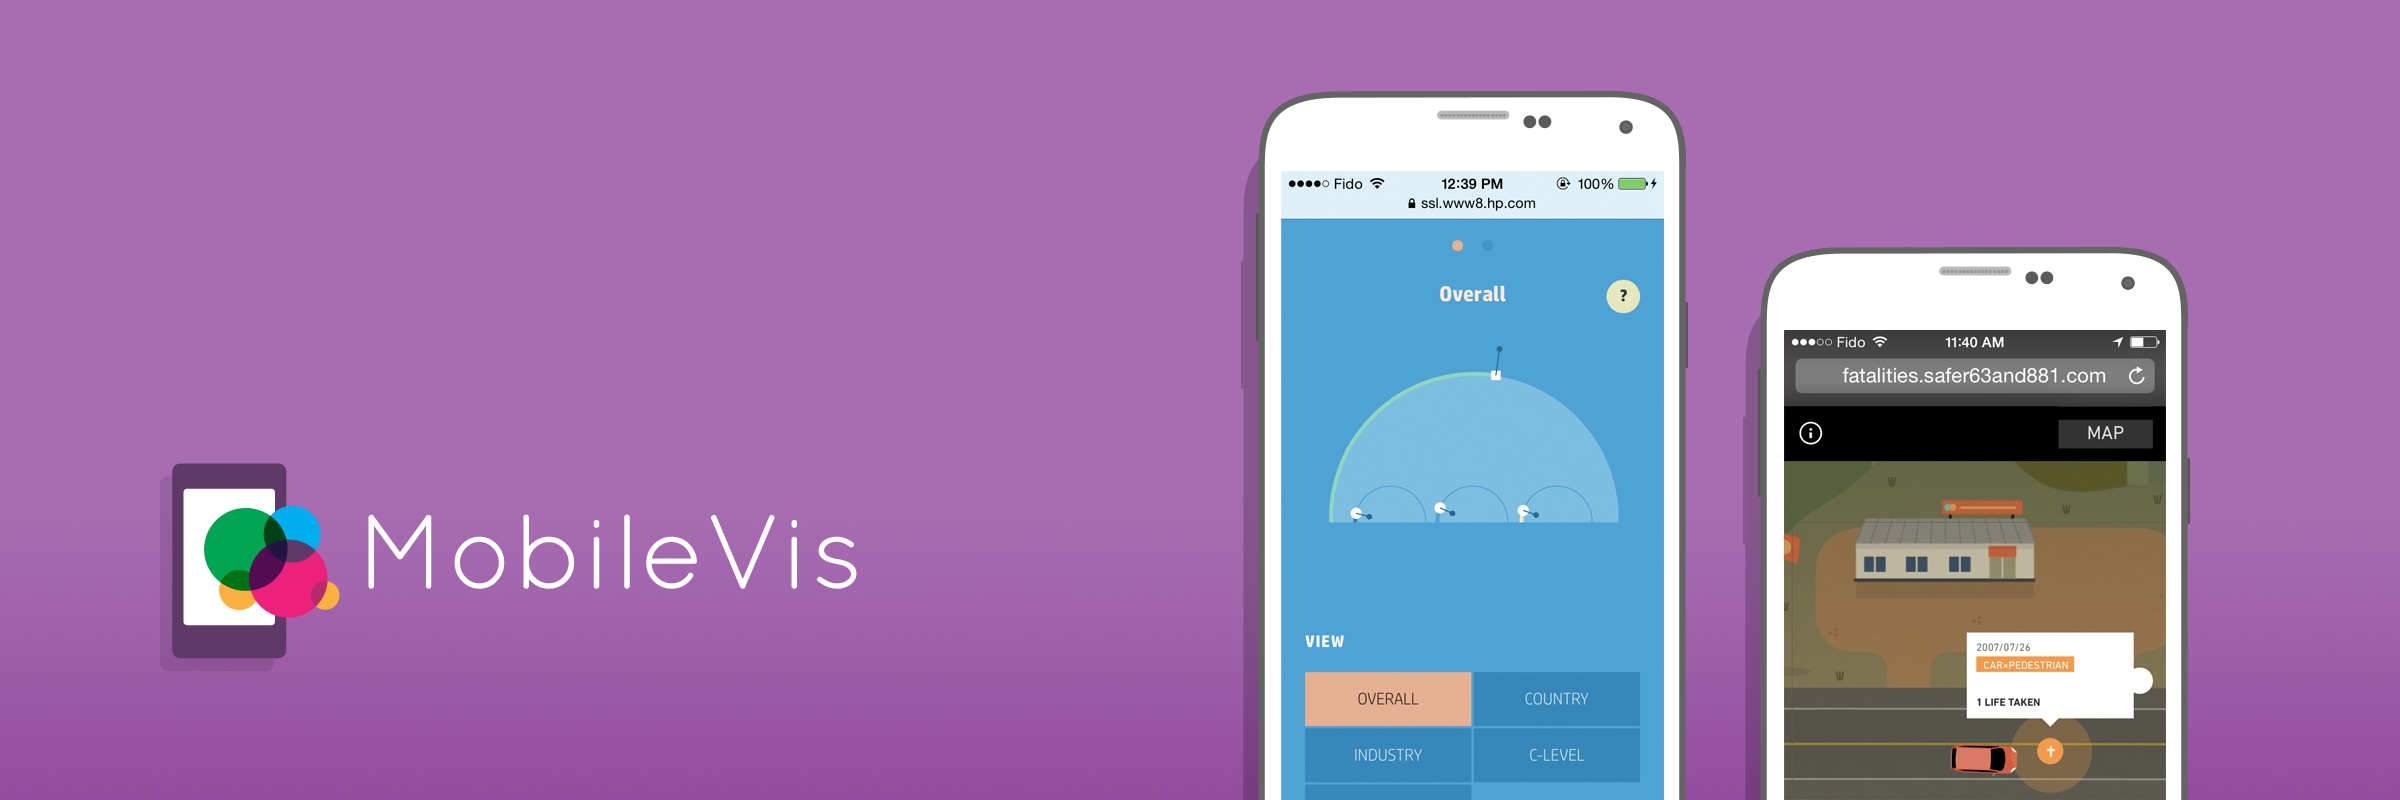
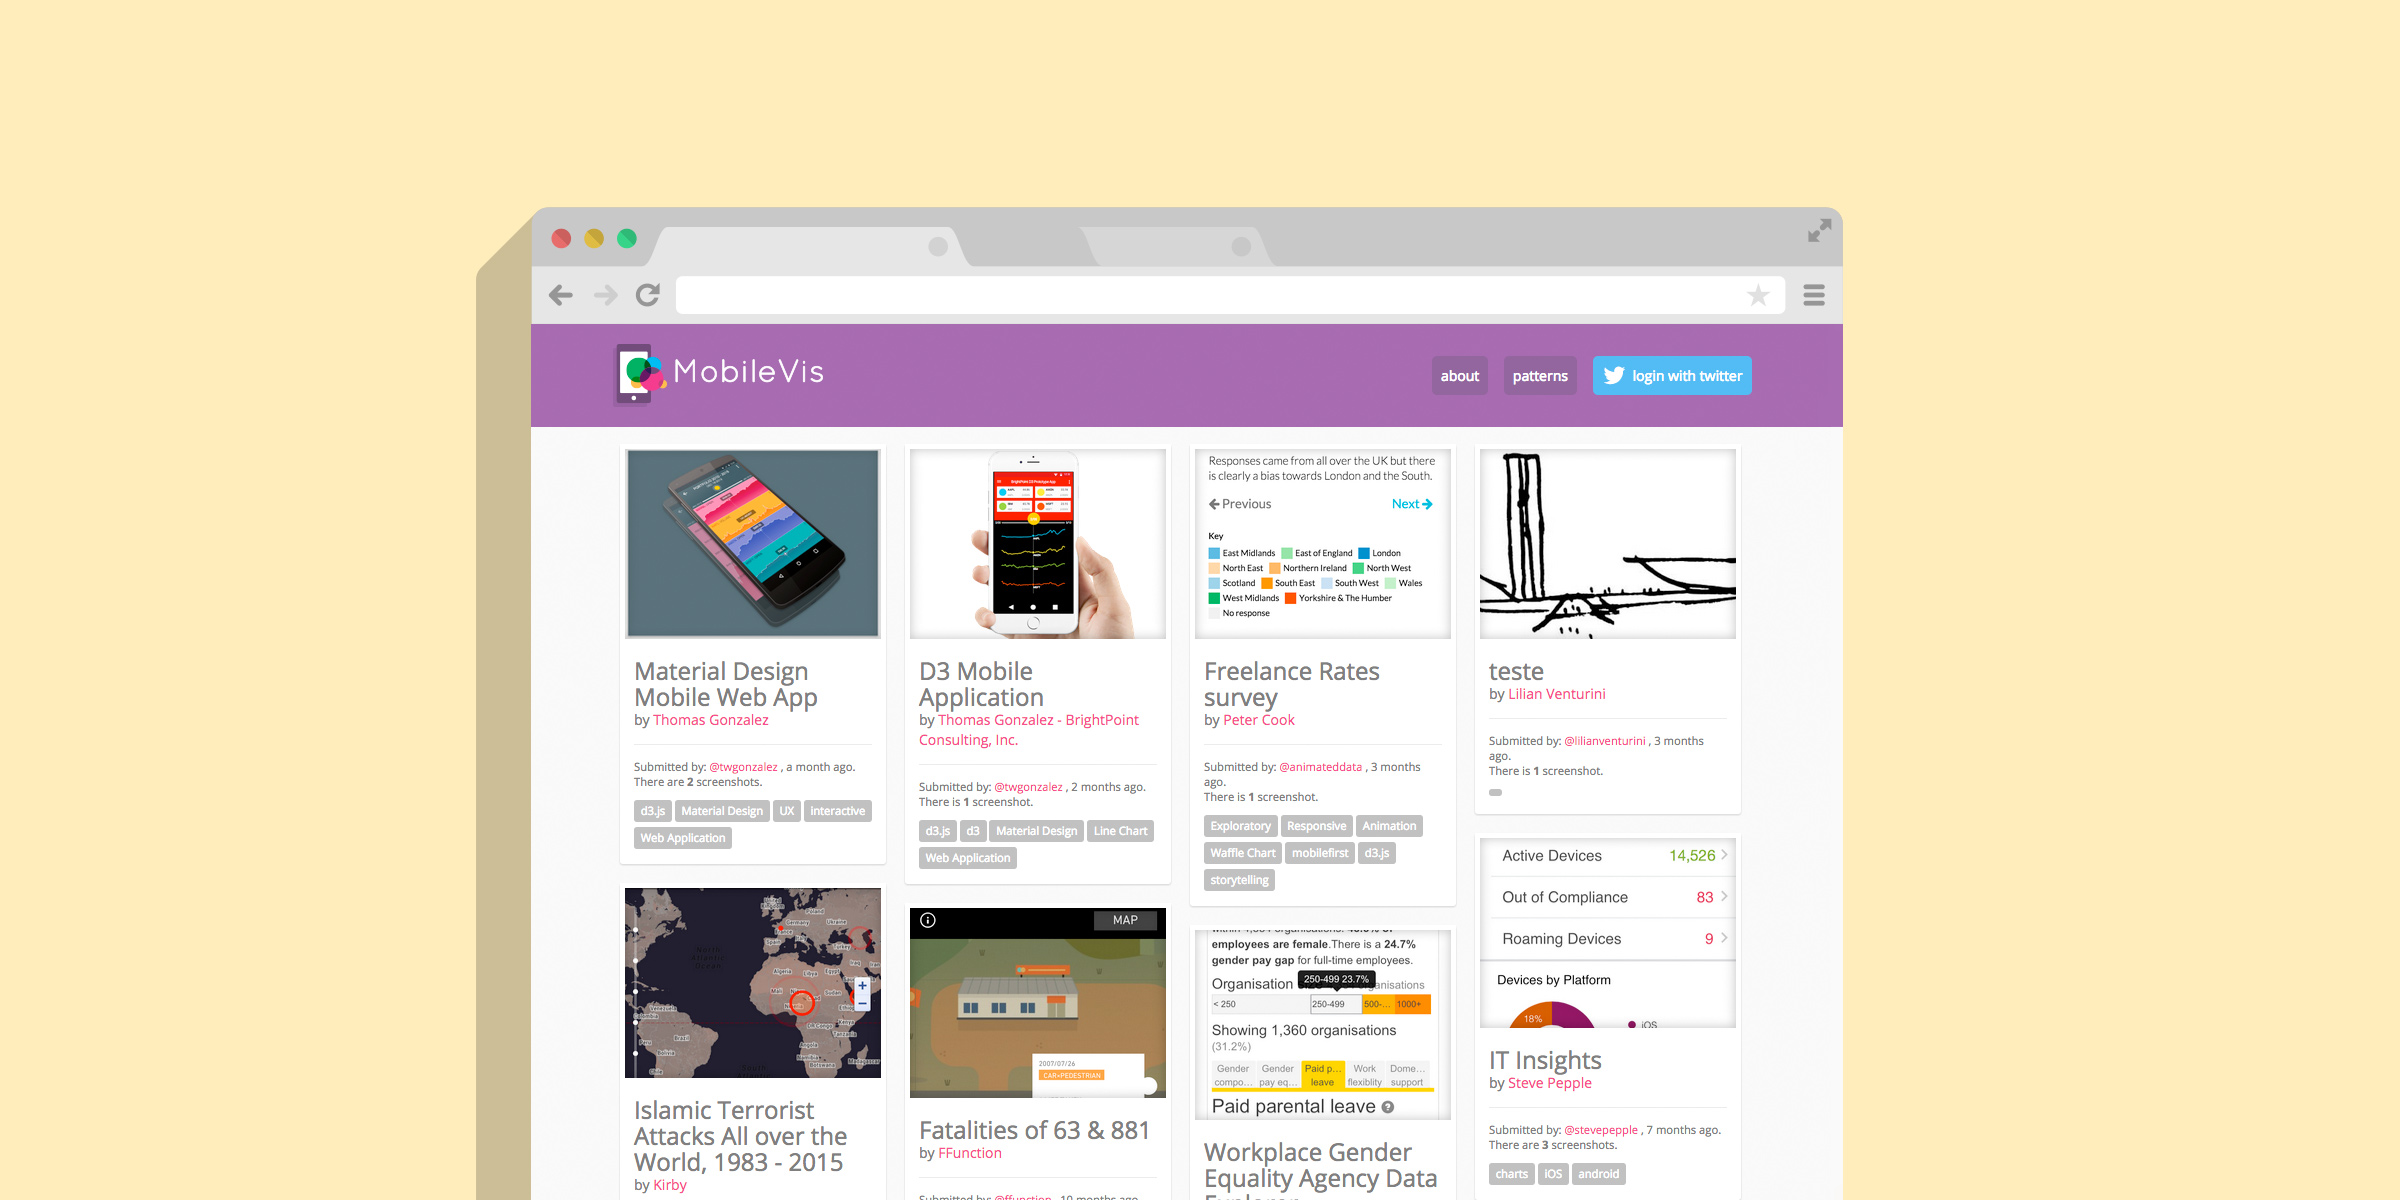
The Bocoup Data Visualization team built a platform for collecting, annotating, and sharing examples of visualizations designed for mobile and tablet screens. MobileVis aggregates patterns that can inform those who need to design visualizations for smaller screens.

MobileVis
Knight Foundation
Collecting patterns and examples of data visualization use on mobile devices
View project
Challenge
Data visualization is common in everyday communication online and in print media. As consumers shift to mobile devices for their daily information consumption on the web, we are faced with the challenge of designing new interfaces and interactions that work with these smaller screens. While Responsive Web Design alleviates some of these challenges, data visualization brings some additional complexities to the table when it comes to displaying and interacting with information.
Solution
The Bocoup Data Visualization team, with support from Knight Foundation's Prototype Fund, built MobileVis, a platform for collecting, annotating, and discussing examples of data visualization interfaces built on mobile devices. MobileVis also offers a set of patterns to inform developers designing for smaller screens.
Impact
The MobileVis platform has seen steady usage in the community. New projects are added regularly by members of the community, and newcomers cite the collection as a valuable resource for embarking into the mobile visualization space.

More work like this at Bocoup

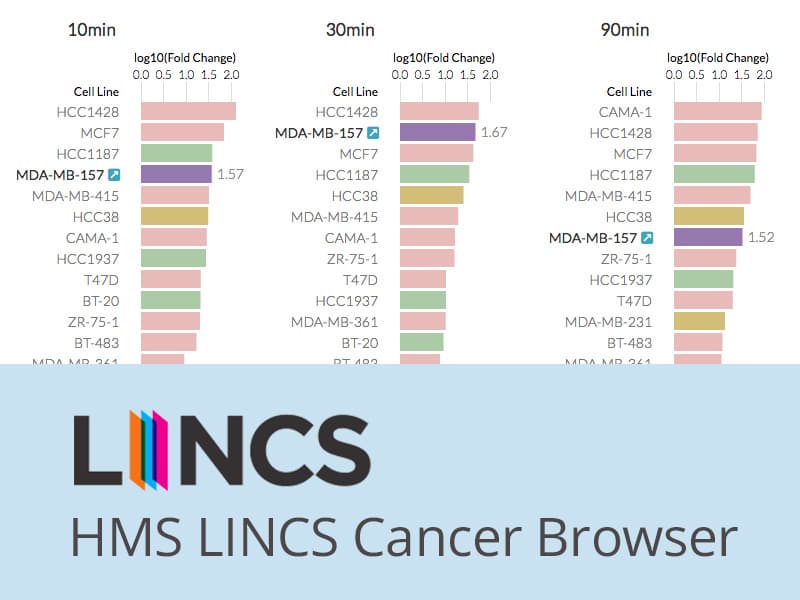
HMS LINCS Breast Cancer Browser
Harvard Medical School

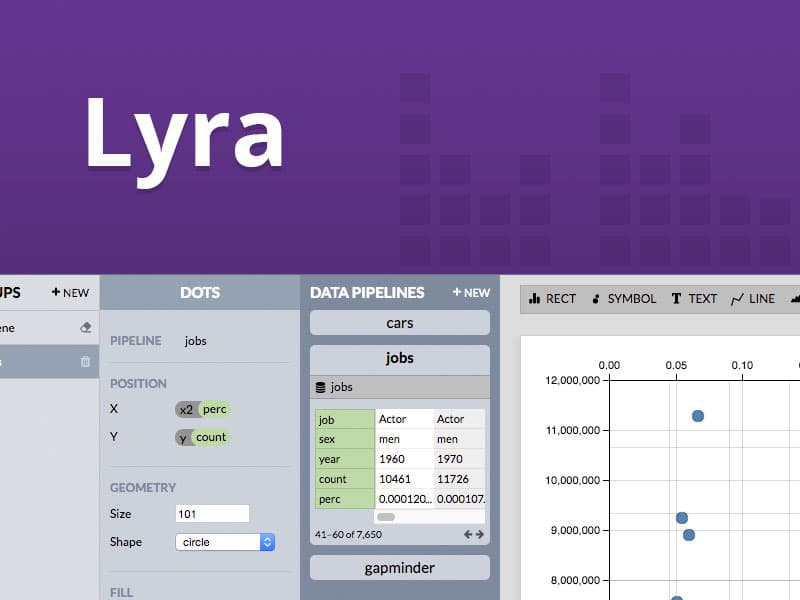
Lyra – Visualization Design Environment
University of Washington Interactive Data Lab
Contact Us
P.O. Box 961436
Boston, MA 02196