Learning Three.js With Real World Challenges (that have already been solved)
Posted by Sue Lockwood

Illustration by Sue Lockwood
When exploring a new library or language, I like having a clear set of requirements with an end goal in mind. For me, learning new technologies through client work is ideal—I use the project requirements as a guide to push me to do things I might not normally try on my own.
“Hello World” or TodoMVC style introductions seem to be created solely so a new user can feel successful with a given tool. While these resources have their place, I’d much rather dig in with messy real world challenges. When my work doesn’t present an opportunity to explore a technology I care about, I usually reverse engineer something complex that already exists.
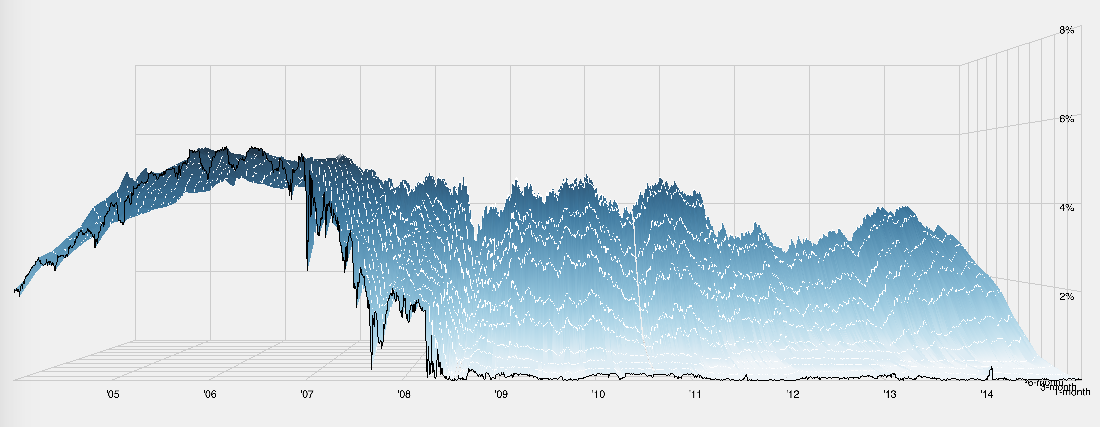
I’ve been playing with WebGL a lot lately (a JavaScript API for rendering interactive 3D graphics in the browser). I haven’t had a chance to use it in my client work yet, but I recently found a perfect example for reverse engineering. It was this article on the New York Times: A 3-D View of a Chart That Predicts The Economic Future: The Yield Curve.
The data visualization within was created by Gregor Aisch and Amanda Cox, and it features a unique way to represent information you would normally see in a 2D area or line graph.
I decided to recreate this visualization as a way to learn Three.js. This graph appealed to me because it wasn’t just aesthetic, there was real data used to generate it.
Hello 3D world!
It can be a little difficult to get started when working in 3D space. Keeping track of a 2D graph on a 2D screen is straightforward, but with a third axis it can be trickier to understand what’s happening. I decided to start by making the axis grids so I would have guidelines for plotting my data.
Create your own grid method
First I tried using Grid Helper, a method Three.js gives you for creating grids. The method only takes 2 parameters though, size and step, so the result would always be a square. The chart I was trying to duplicate shows more than 20 years of daily data over 11 interest rates in a rectangular visualization. So, first things first, I created my own grid method to set the width, height, and step independently.
//----------------------------------------------------------------------------
// opts
// {
//  height: width,
//  width: depth,
//  linesHeight: b,
//  linesWidth: c,
//  color: 0xcccccc
// }
//
//____________________________________________________________________________
function createAGrid(opts) {
  var config = opts || {
    height: 500,
    width: 500,
    linesHeight: 10,
    linesWidth: 10,
    color: 0xDD006C
  };

  var material = new THREE.LineBasicMaterial({
    color: config.color,
    opacity: 0.2
  });

  var gridObject = new THREE.Object3D(),
    gridGeo = new THREE.Geometry(),
    stepw = 2 * config.width / config.linesWidth,
    steph = 2 * config.height / config.linesHeight;

  //width
  for (var i = -config.width; i <= config.width; i += stepw) {
    gridGeo.vertices.push(new THREE.Vector3(-config.height, i, 0));
    gridGeo.vertices.push(new THREE.Vector3(config.height, i, 0));

  }
  //height
  for (var i = -config.height; i <= config.height; i += steph) {
    gridGeo.vertices.push(new THREE.Vector3(i, -config.width, 0));
    gridGeo.vertices.push(new THREE.Vector3(i, config.width, 0));
  }

  var line = new THREE.Line(gridGeo, material, THREE.LinePieces);
  gridObject.add(line);

  return gridObject;
}
Put everything into a 3D object
If you look at the grid code, you’ll see I am adding THREE.Line to an Object3D called gridObject. When creating a scene in Three.js, whether it’s a graph or an art project, you tend to have a few different geometries on the page, such as lines, spheres, cubes, etc.
If I could teach everyone one thing about Three.js to make their lives easier, it’s this: Object3D is the best thing in the entire world. Put everything in Object3D. Everything. That object can be positioned around your scene based on a single center point, instead of managing transforms on many smaller individual geometries. Transforming one object is always easier than transforming hundreds. You can even put Object3Ds in OBJECT3DS!
Here are two animations to show the difference between rotating objects on their own and within a parent Object3d.
Now if I put all three grids in a parent Object3D and then rotate it, you will see the following:

Labels
After getting the grid together, I thought figuring out labels would be a good next step. Based of my previous project experience with old school Processing and ancient JavaScript data visualization libraries that used VML from the late 2000s, I thought labels would be a pain point.
I experimented with showing text in Three.js in multiple different ways, from injecting html into the graph with cssRenderer to using TextGeometry.
In the end, the solution I used for this was sprites, which are planes in a 3d scene that always face the camera. Using sprites allows for the labels to always be visible when viewing different sides of the graph. However, too many sprites on a page can slow down the GPU. To address this, I used Lee Stemkoski’s sprite text to create a sprite as a canvas.
function makeTextSprite(message, opts) {
  var parameters = opts || {};
  var fontface = parameters.fontface || 'Helvetica';
  var fontsize = parameters.fontsize || 70;
  var canvas = document.createElement('canvas');
  var context = canvas.getContext('2d');
  context.font = fontsize + "px " + fontface;

  // get size data (height depends only on font size)
  var metrics = context.measureText(message);
  var textWidth = metrics.width;

  // text color
  context.fillStyle = 'rgba(0, 0, 0, 1.0)';
  context.fillText(message, 0, fontsize);

  // canvas contents will be used for a texture
  var texture = new THREE.Texture(canvas)
  texture.minFilter = THREE.LinearFilter;
  texture.needsUpdate = true;

  var spriteMaterial = new THREE.SpriteMaterial({
      map: texture,
      useScreenCoordinates: false
  });
  var sprite = new THREE.Sprite(spriteMaterial);
  sprite.scale.set(100, 50, 1.0);
  return sprite;
}
![]()
Getting the Data
Now, I had my axis and labels, but no data. With Irene’s help, I managed to find the data used in the graph on the U.S. Department of Treasury’s website. I scraped the data I needed with a Node.js script using Express, Cheerio, and Request, and created JSON that looked like this.
When I grabbed the data, I wasn’t thinking about the format it should be in when consumed by Three.js. After I’d collected all the data I needed, I realized that for a 3D graph I would need to have vector coordinates [x,y,z] for each point. In this case it would be Date, # of months, and yield curve rate. Using Node.JS, I manipulated the JSON I’d created into those coordinates, with date and months being represented by a single number. For data listed as “N/A,” I used null values. See my data.
I now had my data and was ready to start plotting!
Plotting the Data
My goal was to create a 3D area graph where the colors changed based on the value of the yield rate. The graph needed projected axis lines for the z axis too (the white lines you see on the original graph).
The NYT’s visualization reminded me of a terrain map from a videogame, so that’s what I looked into making. If I could create a plane with the right amount of vertices then I would just need to alter the Y value to create different “altitudes.” Then, after calculating the color value using the Y value, I could add the color to the vertex color of each face. This worked great… almost.
When I created a planeGeometry object, I learned something troubling about my data. The number of vertices programmatically created in the plane and the number of data points I had were off. I had assumed there would be at least 365 data points per year (not counting leap years), but I was off, by ~2k points. This caused my code to break when looping through the data to alter the Y value of each vertex. I went back to the data and discovered that each year did not always have 365 data points.
What do you do when you’re missing data?
I went back and adjusted my script for changing the data into vector coordinates to account for every day. I used moment.js so I wouldn’t need to worry about leap years or dates (and frankly, because I’m lazy), and I checked the date difference between 2 entries. If it was more than 1 day, then I added the missing data points by interpolating the missing point using the previous and following point. I did this because if I left the values as null, there would be holes in my graph.
I still had a slight data problem because I was working with dates from January 2005 to April 2015, but I wanted those low rate values seen in the NYT graph. I decided to keep this date range so I could compare my work against the other at a glance. To create the sections where the graph drops off (best seen from the above view) I converted null values to strings. For some reason this worked visually. Hacky? Absolutely. With more time I would dig into this and polish this data to perfection, but for this self-guided assignment I had to tell myself that, sometimes, hacky is ok.
Different Views
The original piece shows the chart in both 3D and 2D views. Its animation suggested that when switching to the ‘2d’ view it does not rerender as a flat chart, but instead changes the camera in order to give the appearance of a two dimensional graph. I didn’t recreate the lovely animation from the NYT visualization. Just solving the problem of 3D to 2D view was enough for me.
After playing around with Three.js’s camera, I knew what I had to do. There is an effect in movies called Dolly Zoom, which was made popular in Alfred Hitchcocks’s Vertigo and has been used in many other films such as Jaws, The Godfather, and Lord of the Rings. The dolly zoom increases the field of view(FOV) of the camera while moving away from the subject, keeping the subject the same size.

Conclusion
After all of that, this is what I was able to create. It doesn’t have the polish of the NYT’s visualization, but it fulfills the requirements I set for myself.
By tackling this already solved real world challenge, I was able to learn a lot more about Three.js than I would have learned using just tutorials.
Often in my career, when I’ve started a passion project to learn a tool or language, I’ve received negative feedback from peers for spending time “reinventing the wheel.” Usually, the people who say this miss that the problem I’m solving is gaining a new skill-set, not bringing more of the same into the world. As I see it, 2+2 is a solved equation, but we still put it on tests in first grade.