Visualizing OpenVisConf: Analyzing 10 hours of video
Posted by Yannick Assogba
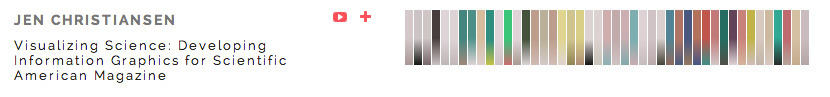
Bocoup recently hosted OpenVisConf and we wanted to think of a fun and useful way to present the proceedings. We created a visualization that uses the slide transitions in speaker videos to produce a visual overview of each video. You can see the result here.
You can click on the colored rectangles to expand them and see thumbnails of each frame shown and further click those to start the video playing at that point in the talk.
In this post I want to share a bit of the process for how we generate the data for the visualization, and hopefully show how easy it is to get started with video and image processing.
Process
Our goal is to extract interesting frames that could give a visual overview of the video. In this case, we can define interesting as a slide change, though we don’t want to completely ignore transitions in animations either.
To achieve this goal we will use OpenCV to process the video. OpenCV is a computer vision library with official support for C++, Java and Python. For this project I used the Python bindings.
Each video goes through 4 main steps.
1. Frame Skipping & Preprocessing
We first extract one frame per second from the video to produce a new video that is dramatically smaller in size. This makes the subsequent steps execute much faster. We may also need to crop the video down to just the portion with the slide content.
2. Frame Differencing
We then take each frame and subtract it from it’s previous frame to calculate the number of pixels that have changed. We record this number in a data structure for use in the next step. In OpenCV this image differencing is as straightforward as diff = cv2.subtract(currentFrame, lastFrame). In order to make this faster and more robust with respect to noise (e.g. analog noise in the video signal), we convert to grayscale, shrink, and then blur the frame before we calculate the difference. This can be achieved in a few short lines of python
gray = cv2.cvtColor(frame, cv2.COLOR_BGR2GRAY)
gray = cv2.resize(gray, None, fx=0.25, fy=0.25, interpolation = cv2.INTER_AREA)
gray = cv2.GaussianBlur(gray, (9,9) ,0.0)
This is a pretty simple approach for detecting changes and it works decently well for our use case. OpenCV has support for more advanced techniques where you first try to learn or estimate which pixels are background pixels and separate them from the foreground before looking for changes. This approach does not work well for all slide decks because the ‘background’ can change dramatically from one slide to the next.
3. Scene Detection/Keyframe Selection
To select keyframes that represent likely scene changes (aka slide transitions), we examine the data we collected about each frame in the previous step and calculate some basic summary statistics such as the mean and standard deviation of the number of pixels that change across all frames in the video. We then loop over all the frames again and select as our keyframes the ones where the number of pixels that have changed is more than ‘X’ standard deviations from the mean. We write out the selected frames as images at various scales to use on the web.
Using these statistics helps us further filter out changes that are due to noise in the original signal (which should be evenly distributed across all frames) as well as gives us a loose way to tune how many frames we want to get back. A higher value for ‘X’ will produce fewer frames with greater inter-frame changes while a lower one should produce more frames with more subtle changes. In this project I experimented with values from 1 to 2, and settled on 1.85 just via visual inspection of the result for this set of videos.
4. Dominant color extraction
At this point we have a set of thumbnails that we can use to give an overview of the video. But in designing the visualization I wanted a more compressed view than the image thumbnails. So let’s go back and extract more data from the video frames. For each selected keyframe we extract 5 dominant colors. This is done using K-Means clustering, a simple machine learning technique that was actually explained by one of our speakers, David Mimno, in his OpenVisConf talk. K-Means is built into OpenCV so it’s just a few lines of code.
# convert to np.float32 matrix that can be clustered
Z = image.reshape((-1,3))
Z = np.float32(Z)

# Set parameters for the clustering
max_iter = 20
epsilon = 1.0
K = numCols
criteria = (cv2.TERM_CRITERIA_EPS + cv2.TERM_CRITERIA_MAX_ITER, max_iter, epsilon)

# cluster
compactness, labels, centers = cv2.kmeans(Z, K, criteria, 10, cv2.KMEANS_RANDOM_CENTERS)
You can imagine it as plotting the color of each pixel in a 3-dimensional space (one dimension for each color component) and then finding clusters of points in that space. We use the centroid of those clusters (which will be a coordinate representing a color) as the dominant colors in the image.
In our visualization we used the 2 most saturated colors to generate our gradients as opposed to the two largest clusters (which will often be the background) to give it a bit more pop.
Visualization and more…
And that is basically it! We’ve generated a selection of frames from the video as well as color information about those images that we can then use to do other things; such as create a web page to present these videos.
The code for doing this video processing is available in this repository. I don’t write much python but it was really easy to get started and become productive, so I encourage you to look into it if you have a relevant project.
The front-end visualization code from the OpenVisConf site is also available here. It represents a slightly condensed version of what you can see on the OpenVisConf site and is an example of how the data produced from this process can be presented.
Special thanks to Irene Ros, Isaac Durazo and Greg Smith for their help and feedback.
Happy Hacking!